Heart rate variability (HRV) is an important marker of an individual’s overall physiological stress level. External and internal stressors affect our health and our HRV. When properly analyzed in the context of our overall health and lifestyle, HRV monitoring can help everyday folks and athletes alike optimize their health and their training. Only recently have routine HRV assessments been available to the general public. This is part 1 of a two-part post. We will explore the basic tenets of HRV and how we can use it to monitor our health. Part 2 will explore how HRV can be utilized to improve our training, load management and how we adapt over time.
How Does HRV or Heart Rate Variability Work?
Our heart rate, the speed at which our heart beats is governed by many variables… including our nervous system. Our nervous system has many working parts. The “autonomic” nervous system is but one of them. Our cardiovascular system is mostly controlled by autonomic regulation through the activity of both the “sympathetic” and “parasympathetic” pathways that make up the autonomic nervous system. Our autonomic nervous system affects our heart rate, stroke volume (how much blood you pump with each beat), blood pressure, and where the blood will go once it leaves your heart.
Autonomic Nervous System:
Sympathetic Nervous System: Your sympathetic nervous system revs us up. It is responsible for our fight or flight response. It accelerates our heart rate, increases our blood pressure, and shunts our blood flow to our muscles and brain.
Parasympathetic Nervous System: The parasympathetic is our more soothing contributor to our autonomic nervous system output. It slows our heart rate, slows our breathing, and decreases our blood pressure.
As you can imagine, the higher your heart rate is the lower your overall health profile. Various stressors contribute to our overall sympathetic tone. Your health is a possible stressor. Exercise is a stressor… too little or too much exercise will affect your HRV. Your work and home life are stressors too. The higher our overall “stressor’ level, the more sympathetic tone we have. A higher sympathetic input will decrease your HRV. A decrease in HRV can be reflective of poor health, exhaustion, and illness. Basically, the more parasympathetic tone the higher your HRV will be. In general, that reflects a healthier and more relaxed internal condition.
Autonomic inputs and HRV
Analysis of your HRV enables us to understand the overall health of your autonomic nervous system. Several studies on HRV have highlighted how different features can provide insights into autonomic regulation and especially on parasympathetic activity, the branch of the nervous system mainly responsible for the body’s resting functions.
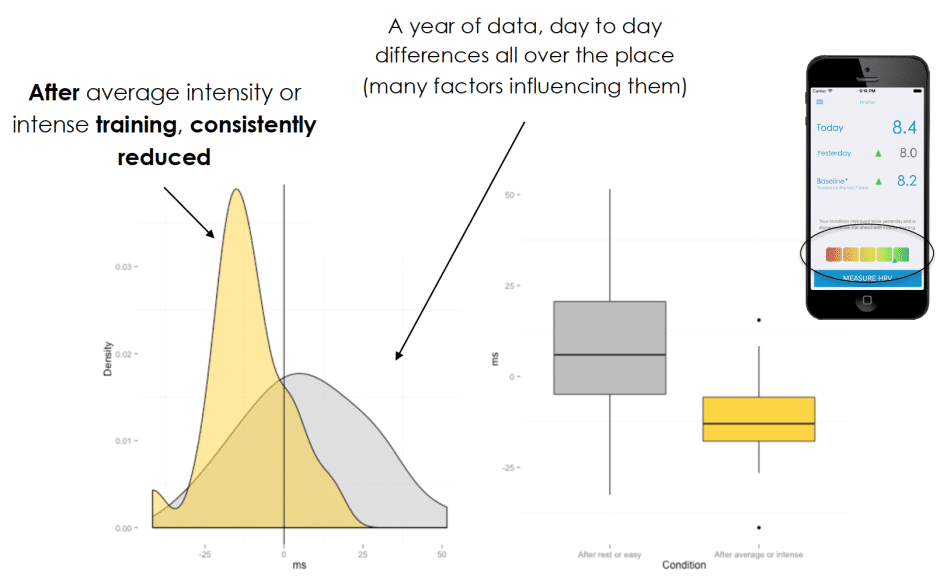
Simply put, monitoring parasympathetic activity via HRV can provide insights into physiological stress, with a higher level of stress resulting in lower HRV. For example, in the context of sports, heavy training is responsible for shifting the cardiac autonomic balance toward a predominance of the sympathetic over the parasympathetic drive. This means that heavy training will typically reduce HRV. Therefore, by monitoring HRV we can hopefully adjust and optimize training, reduce the risk of overtraining and ultimately improve performance.
Your heart does not beat at a constant frequency. There is a noticeable difference between each R wave in the EKG above. That difference is the HRV.
Getting Your HRV Data
Over the last few years, technological advances have made accurate daily HRV assessments available without the need for any external sensor or device.
HRV4Training App:
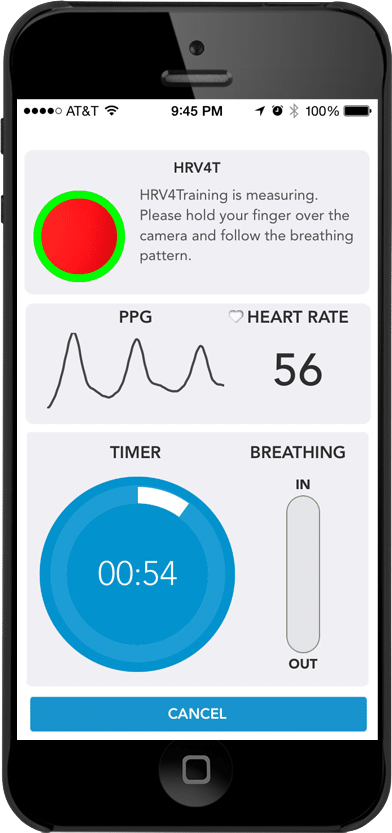
This app requires no equipment other than your phone. It is very useful for monitoring your daily HRV. All it takes is one minute every morning.
HRV4Training App
HRV4Training uses your phone’s camera to extract “photoplethysmography” (PPG) data, (basically blood flow to the finger). The app then determines markers of the autonomous nervous system activity, in particular parasympathetic activity. The technique has been clinically validated and proved to be a reliable measurement, as good as standard electrocardiograms with sticky gel electrodes. By quantifying parasympathetic activity (calming) the app is able to translate the information into an assessment of health, stress, training load and provide actionable insights into your physical condition. This helps users to better understand how their body responds to various stressors and other important factors in life (e.g. sleep, stress, etc.).
Comparison between RR intervals extracted from a chest-worn Polar H7 sensor and the iPhone Camera using the signal processing techniques implemented in HRV4Training. The data was collected during a paced breathing exercise. Increases and decreases in RR interval values due to inhaling and exhaling are clearly visible in both traces.
Oura Ring:
The Oura ring has been available for a few years. Packed inside this stylish ring are sensors that monitor your HRV, heart rate, body temperature, and sleep cycles. Personally, I find the HRV data to be the most relevant to my health. I think that stressing over your sleep score might end up causing you to sleep less ;-).
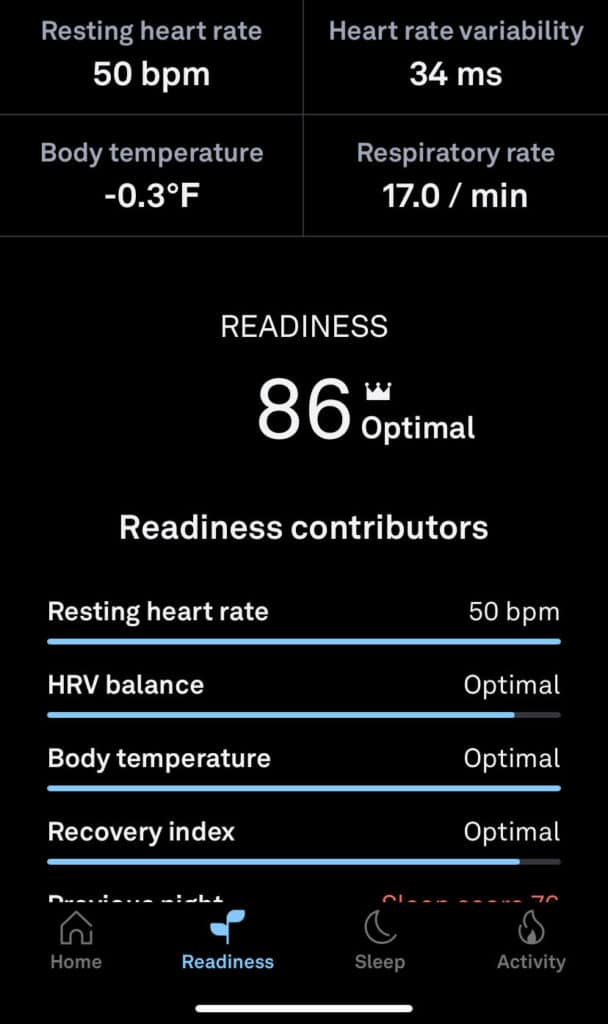
Below is the readiness feed from the Oura ring app. That little ring might give you a good deal of insight. Readiness scores in general are arbitrary and worthless. But tracking your HRV and resting heart rate can be of significant value. Of note, that HRV reading is relevant to me in the context of my short-term and long-term HRV trends. That HRV number should not be used to compare yourself to others. Far too many variables determine what your HRV is. It is your own individual trend that matters, not how you compare to others.
The Oura ring measures your HRV throughout the night. That data is available the next morning. Combined with your heart rate, the app will give you some idea of your overall stress level based on how well you slept, how your heart rate compares to your prior weeks of data, and how your HRV data should be interpreted.
Most useful for me is that the HRV4Training app can use the Oura HRV data. That way I do not need to assess my HRV in the AM with the HRV app. For me, using both the Oura app and the HRV4Training app has given me very useful signals to determine how restful my night was and what my body is prepared to do today.
Recently I have switched to only using the HRV4Training app. I prefer a 1-2 minute assessment in the morning to the entire overnight HRV data from the Oura ring. The rationale is simple. I have many PVCs and other irregular heart beats and they contribute to making the data very messy across an entire evening.
From HRV Data to Health-Related Insights
Even with the right tools, HRV can be difficult to gather under the right conditions and can be especially difficult to interpret. Many factors influence HRV, from body posture to respiration, age, genetics, gender, physical exercise, chronic health conditions, and more.
So how can we get reliable insights from our HRV data?
Determine your HRV Baseline
You should not use your HRV data to compare yourself to others. It is unique to you. Not only will morning readings tell you how your body handled the previous day, but the longer-term HRV trend can also tell you how your body is responding to any lifestyle changes you may have implemented. Let’s say you’ve chosen to walk more. Your morning HRV can tell you if your body recovered well from your previous day’s walk. Your longer-term trend will tell you how your body is responding to your walking. You should notice that your HRV is slowly increasing over time. That tells you that your health is improving. Sometimes objective data can help us stick to a healthier lifestyle change when we see the effects it is having on us!!
Remember, we need to look only at measurements with respect to ourselves. Going to Google and comparing ourselves to age-matched controls will not help you very much. And it might just stress you out unnecessarily. This means that we need to collect a baseline, or a series of recordings so that the effect of different stressors are always evaluated with respect to what your normal values are. The best HRV insights come after monitoring yourself for weeks-months.
Because so many variables can affect our HRV we also need to try to control for as many of these variables as we can and then evaluate the effect of what we care about. If you ate right before bedtime your HRV will be affected. If you exercise late in the evening, or if you had a few drinks your HRV will be affected. As an aside, any alcohol will affect your HRV values. If you train seriously you should consider not drinking alcohol at all. The HRV4Training app tracks these variables and can show you how they influence your HRV.
HRV Best Practices
Here are a few best practices for short HRV measurements that are very important to follow to get consistent results that can be interpreted correctly:
- Take the measurement first thing after waking up, while still in bed. This way you have a consistent time of the day, and you are not affected by other stressors (the only exception is if you need to empty the bladder, in that case, do it, then go back, rest 1 or 2 minutes to make sure your body is not affected by physical activity, and take the measurement). Don’t read your email before the measurement :-).
- Measurement duration: short measurements have been validated multiple times, and you can trust a 60 second recording for HRV.
- Breathing is key, it doesn’t really matter what breathing frequency you pick, but be consistent, use the same every time
- Body position: lying, sitting, or standing are all good, again what matters is that you do always measure in the same position. If you decide to stand, be patient, wait a minute or two before recording since your body needs to be at rest.
Acute HRV changes and long-term HRV trends:
HRV is typically analyzed in two ways; acute HRV changes and long-term trends. Acute changes refer to the easiest interpretation, i.e. on a day following intense training, walking, hiking, or biking, your HRV might drop. HRV4Training and Oura will provide you with daily advice using a slightly more complex interpretation of this principle.
While it is definitely interesting to look at HRV on a day to day variability basis and understand the impact of intense training sessions, much research is now trying to use this data to understand more about our overall condition over longer periods of time, weeks to months, in the context of a training program [8, 9, 10].
- How are we adapting to a new lifestyle intervention?
- Is our physiological condition improving?
By combining a series of physiological parameters and methods we can definitely learn more about our physical condition and lifestyle interventions we are considering.
By looking together at changes in baseline HRV, meaning our weekly averages over time, as well as looking at the variability within our HRV scores, we start to gather critical insights. For example, if our HRV readings are jumping around a lot during a week or are pretty much the same score every day, together with information about heart rate and of course our exercise program (meaning training load, and intensity) there are some consistent patterns that we can identify.
Research shows that lower variability between readings together with a stable or increasing HRV baseline can be more representative of good adaptation to interventions, while the same reduction in variability between readings when associated with higher heart rate and lower HRV baseline is more representative of fatigue.
Your HRV combined with your heart rate are useful indicators we can use to track our health and well-being. Especially if we are changing our activity level, diet, or considering another lifestyle intervention. Tracking your HRV is simple. You can keep your finger on your phone’s camera for one minute each morning… right?!?
